When you turn on your computer, there are a lot of things you can see. You can find informational articles and news. Many also spend time checking their email to see what notifications have come in. Here at ManagerPlus, we want to showcase our Business Intelligence Dashboards.
A first look at ManagerPlus reporting capabilities

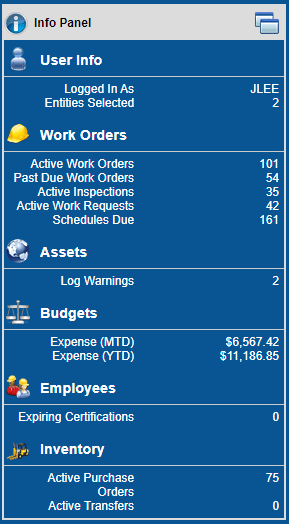 When you first log in to ManagerPlus, you will see the ribbon at the top that has all of the possible modules that you can access. On the left side, you can see your info panel that will help you with some quick numbers, including some quick statistics on work orders, assets, budgets, and your employees.
This is very useful for seeing where you are at a glance. You can very easily click on any of those items to dive deeper. While this panel is useful, it is just the beginning of the data ManagerPlus can reveal to you.
The ManagerPlus Business Intelligence dashboard
The main feature of the software homepage of ManagerPlus is the Business Intelligence Dashboard. We’ve designed this screen to display a personalized custom dashboard as its focus. A dashboard can show you exactly what you want to know when you first log in for the day.
One great example of this is the Work Requests Dashboard:
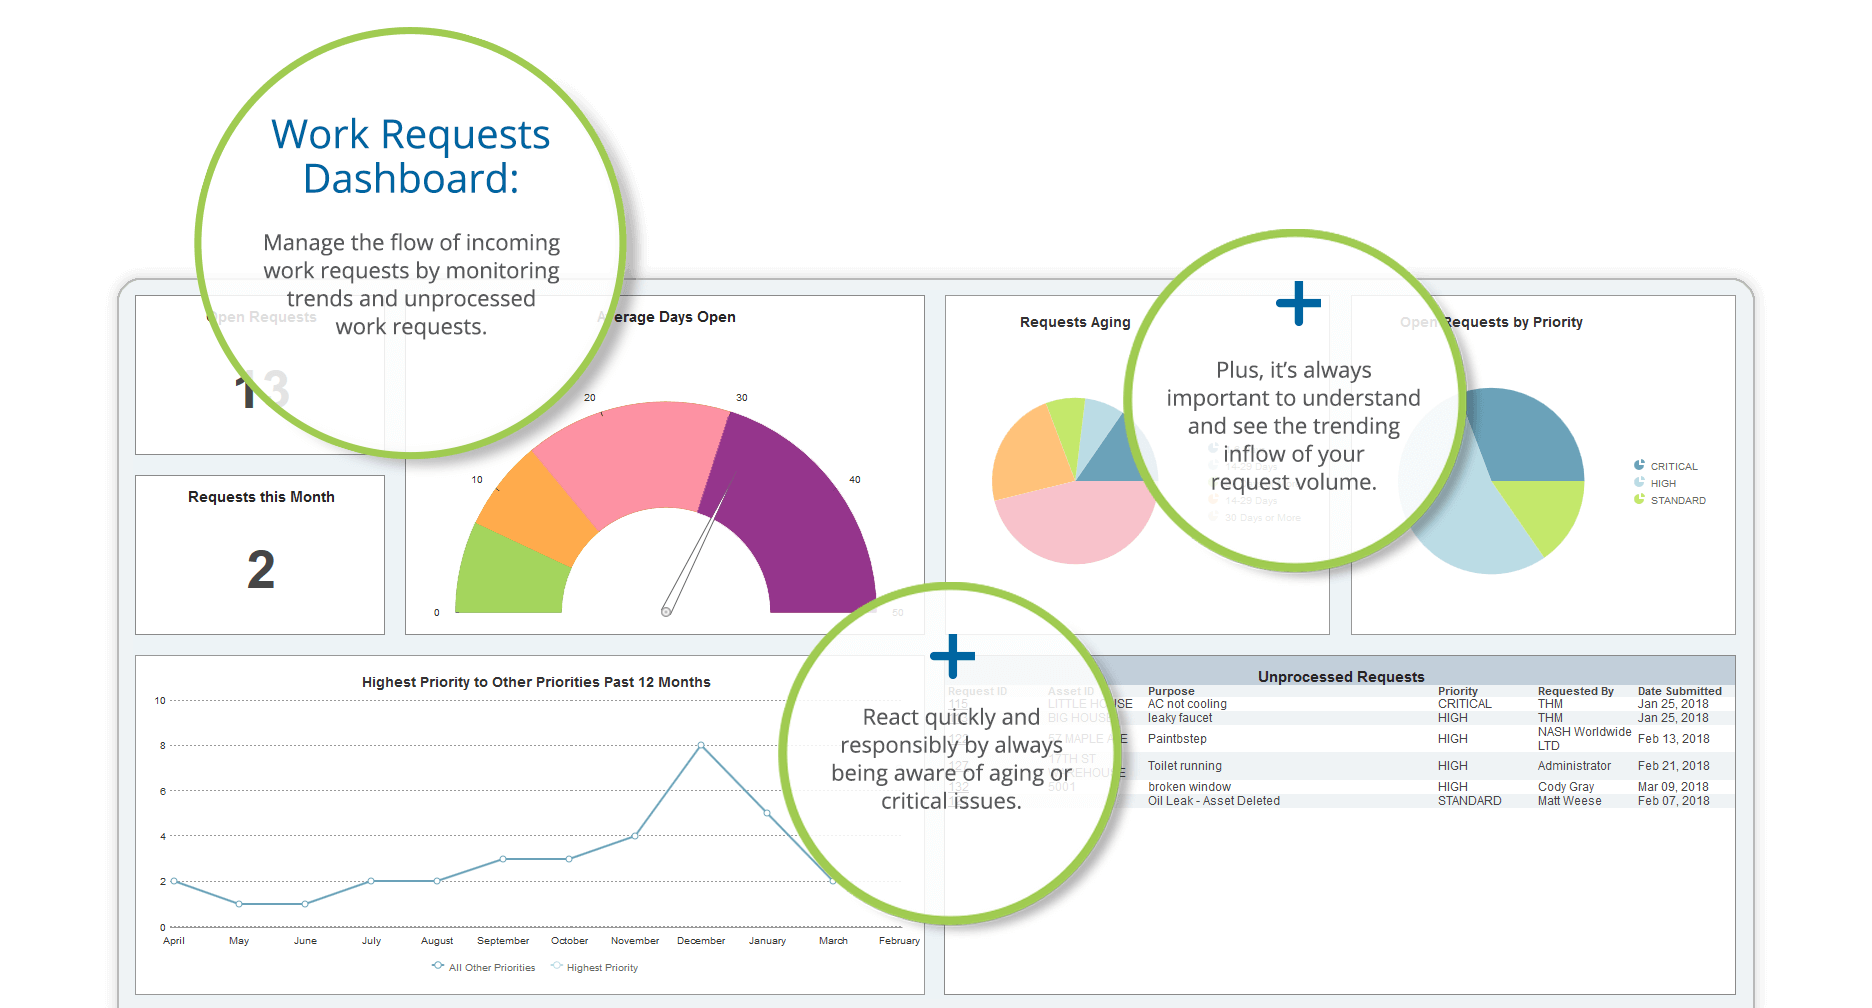
As you can see, it provides a much clearer picture of the different work requests using full color graphs that display data like the current status of all your work requests, their priority, and how many of them have been completed on time. This kind of data gives you actionable insights so you can make important decisions quickly.
Another popular dashboard is our Maintenance Dashboard:
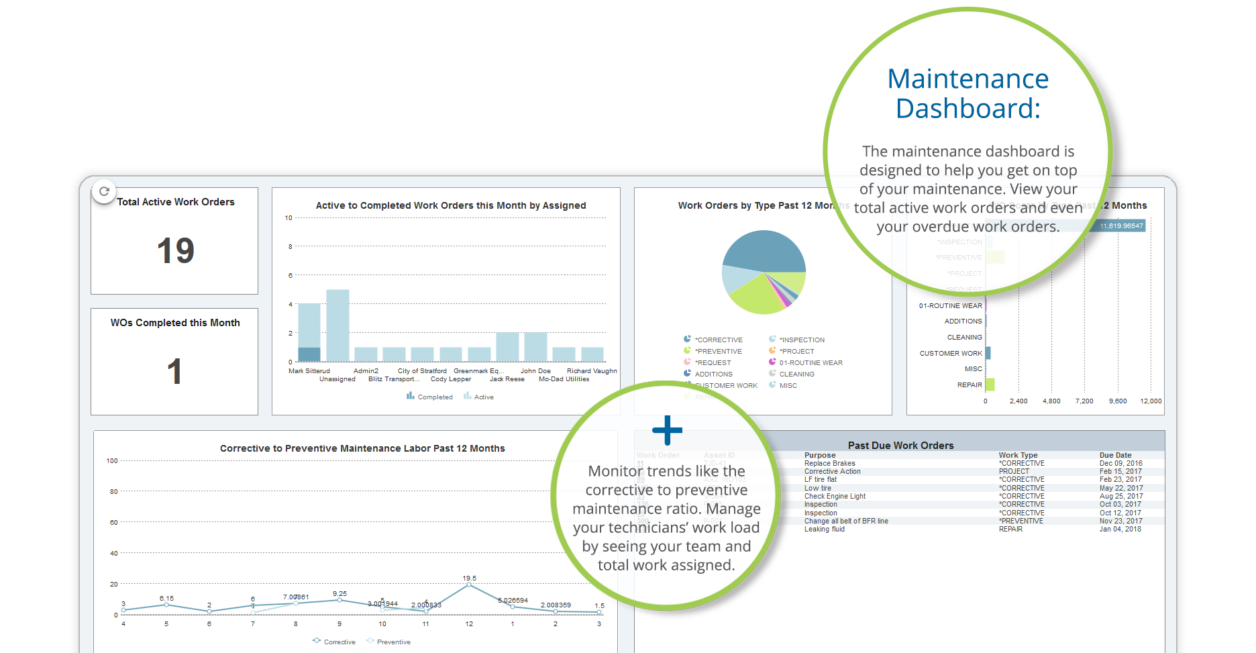
This one helps you see your ratio of corrective to preventive maintenance as a trend over time. It shows how much work is being assigned to your different employees, and what types of work orders are costing you the most. It also includes a list of all of your past due work orders.
The best part about our Business Intelligence plug-in is that it enables you to fully unlock custom reporting within ManagerPlus. If you can imagine a dashboard or report that can be created from your data, it can be created through Business Intelligence. This means analyzing that data has never been faster or easier.
At ManagerPlus, the #1 Asset Management Solution, we bring the power of your assets under your control. This is more than just work order management. This is complete asset management. If you want to see ManagerPlus can do for your organization, give us a call and let us show you how ManagerPlus can work for you. If you already use ManagerPlus, we’d love to hear your success stories.
